How To Use the Applet:
A Graphical Tutorial
How To Use the Applet:
A Graphical Tutorial
-1,2 This applet, depending on your computer, can handle up to 25 points. These points do not have to be in any order. Do not enter 2 or more points with the same x coordinates! The default values are: range -5 to 5 domain -5 to 5 This is also where you must enter the basis functions to be used with the Least Squares Method. These functions should be in terms of x, with one on each line. I use sin(x) for this example.
Select "Input" from the menu at the top of the applet if it is not already selected.
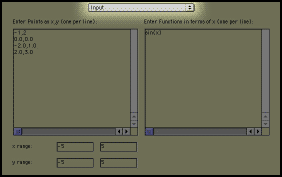
Enter the points you wish to interpolate in the left text box. Enter one pair per line with no parenthesis on the ordered pair. We used the following 4 points:
0,0
-2,1
2,3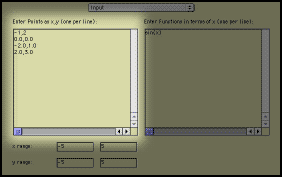
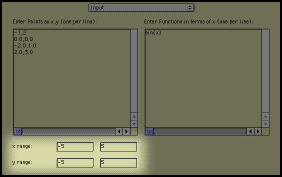
If needed, edit the range and domain for the graphs that will be displayed.
In the right side, you can enter functions that will be displayed along with the Interpolating Functions.
The sin(x) function which appears in this graph is the same sin(x) that was entered in the input page. This feature can be useful for comparing the interpolation with user defined functions. If you drag a point to a new location, you can quickly see the affect this will have on the various graphs. You can drag any point in any of the graph displays. Unfortunately the update only occurs after you release the mouse button, so you cannot see real-time changes. You can copy text from this window by selecting the text and then pressing control-c on your keyboard if you have a PC or command-c if you have a Macintosh. You can copy these equations into Maple of other programs to simplify them or use them in other manners. This box will also display some errors and messages. These messages will look like "***Error Message***" I am ready! Take me to the applet.
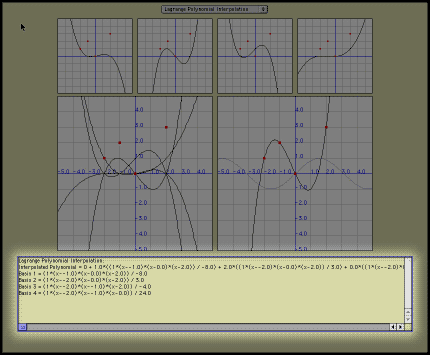
Next Chose an Interpolation method from the top menu. For the rest of this example we use "Lagrange Polynomial Interpolation." A screen similar to the one below will appear. There is a description of each of the methods.
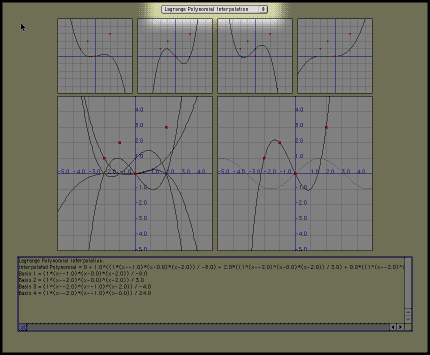
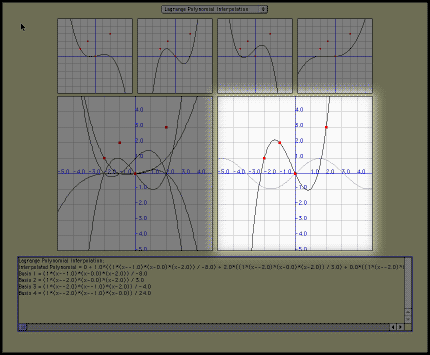
The resulting interpolating function is shown on the right lower graph. This interpolating function is a linear combination of the basis functions shown in the small graphs.
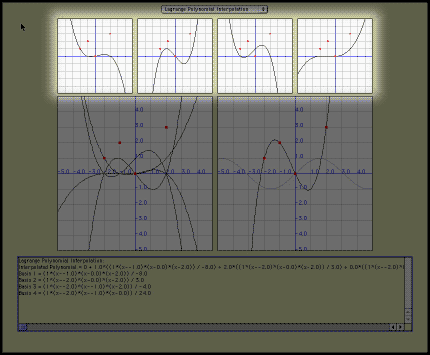
The top four smaller graphs will show the first 4 basis functions for our vector space. If less than 4 basis functions are used, only these ones are shown.
The left large graph will show a composite of all of the basis functions and the input points.
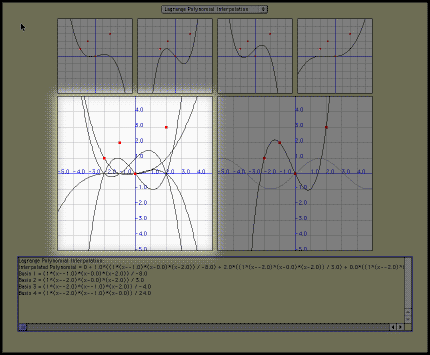
The text box at the bottom of the screen will display the functions that are displayed above.
If you would like some more examples, click here.
©2002-2003 Isaac Dooley